How Much Power Your Commercial Solar Panels Actually Produce (And What It Means for Your Bottom Line)
A typical residential solar panel produces between 250 and 400 watts of power under ideal conditions, translating to roughly 1.5 kilowatt-hours of electricity per day. But that number only tells part of the story. Understanding actual solar production requires looking beyond manufacturer specifications to real-world performance shaped by your location, roof orientation, weather patterns, and seasonal variations.
For business owners evaluating solar investments in 2026, the question isn’t just about peak wattage ratings on a spec sheet. It’s about annual energy yield and how that translates into cost savings and return on investment. A commercial installation in sunny Arizona will produce dramatically different results than an identical system in cloudy Seattle, even with the same equipment.
Production also varies throughout the day and across seasons. Your panels generate maximum output during midday hours when the sun sits highest in the sky, while early morning and late afternoon yields drop significantly. Winter months can see production fall by 40-50% compared to summer peaks, something many first-time solar investors don’t anticipate.
“We installed a 50-kilowatt system at our manufacturing facility last year,” explains Rebecca Martinez, owner of Martinez Plastics in Southern California. “Understanding our actual production patterns helped us shift energy-intensive processes to peak solar hours, maximizing our savings beyond what we initially projected.”
This guide breaks down exactly what affects solar panel output, provides calculation methods for estimating your specific production capacity, and shows you how to connect these numbers to tangible financial outcomes for your business or property.
Understanding Solar Panel Output: The Basics for Business Owners
When you’re evaluating solar energy for your business, understanding how panel output is measured makes all the difference between a sound investment and a costly mistake. Let’s break down the numbers you’ll see on spec sheets and what they actually mean for your operation.
Solar panels are rated by their wattage, which indicates how much power they can produce under ideal laboratory conditions. A typical commercial-grade panel in 2026 ranges from 400 to 600 watts. This rating, however, represents peak performance in perfect conditions: full sun, optimal temperature, and precise positioning.
What matters more for your business planning is energy production over time, measured in kilowatt-hours (kWh). Think of wattage as the rate of production and kWh as the total amount produced. If a 500-watt panel operates at full capacity for one hour, it generates 0.5 kWh. Your utility bill charges you per kWh, so this is the metric that directly connects to your bottom line.
Here’s where reality diverges from those laboratory ratings. A 500-watt panel won’t produce 500 watts continuously throughout the day. Sunlight intensity varies from dawn to dusk, seasons change, and weather interferes. The industry uses “peak sun hours” to standardize these variables. A location with 5 peak sun hours means conditions equivalent to 5 hours of optimal sunlight per day, even though the sun may be visible for 12 or 14 hours.
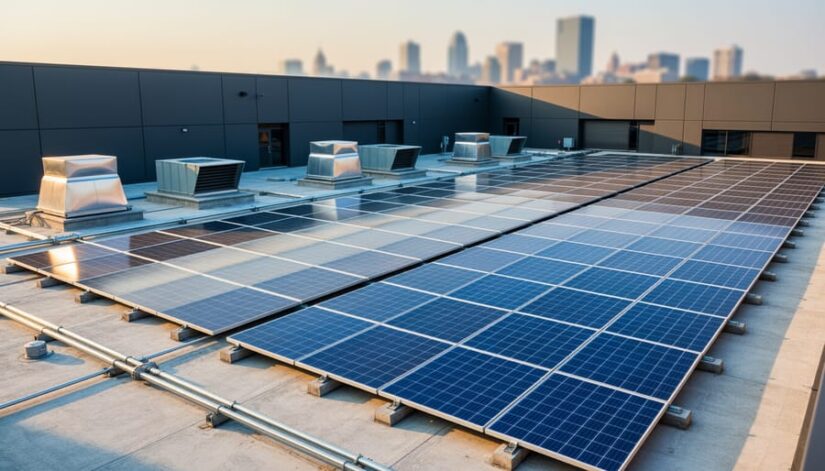
Commercial applications add another layer. Your panels likely sit on flat rooftops or ground mounts with specific orientations. Your facility’s energy consumption patterns matter too. A warehouse that operates primarily during sunny daylight hours captures more direct benefit from solar production than a business with heavy night-time energy demands.
Understanding this foundation helps you interpret production estimates, compare system proposals, and set realistic expectations for your commercial solar investment.
How Much Energy Does a Commercial Solar Panel Produce in 2026?
In 2026, commercial solar panels have reached impressive efficiency levels, with most high-quality commercial-grade panels producing between 400 and 600 watts under standard test conditions. A typical 500-watt commercial panel generates approximately 2 to 2.5 kilowatt-hours (kWh) of energy per day in locations with good sun exposure, which translates to roughly 60-75 kWh monthly and 730-912 kWh annually.
The difference between residential and commercial panels has narrowed in recent years, but commercial-grade panels still offer distinct advantages. While residential panels typically range from 350 to 450 watts, commercial panels start at 400 watts and extend up to 600 watts or more. Commercial panels feature larger physical dimensions, more solar cells per panel, and advanced technologies that deliver higher efficiency ratings, often exceeding 21 percent compared to residential panels at 18-20 percent.
Here’s what you can expect from different commercial panel configurations under typical conditions with about 4-5 peak sun hours daily:
| Panel Wattage | Daily Production | Monthly Production | Annual Production |
|---|---|---|---|
| 400W | 1.6-2.0 kWh | 48-60 kWh | 584-730 kWh |
| 500W | 2.0-2.5 kWh | 60-75 kWh | 730-912 kWh |
| 600W | 2.4-3.0 kWh | 72-90 kWh | 876-1,095 kWh |
These numbers represent production under favorable conditions with minimal shading and proper system design. A 100-panel commercial installation using 500-watt panels would generate approximately 73,000 to 91,200 kWh annually, enough to power most small to medium-sized commercial facilities.
The higher upfront output of commercial panels means fewer panels needed to meet your energy targets, which reduces installation costs, requires less roof space, and simplifies system maintenance. For businesses evaluating solar investments, understanding these production benchmarks helps you estimate how many panels your facility needs and what kind of energy offset you can realistically achieve. The performance gap between rated capacity and real-world production typically ranges from 75 to 85 percent due to various efficiency losses in the system.
Key Factors That Determine Your Commercial Solar Energy Production
Geographic Location and Sun Exposure
Your location fundamentally determines how much energy your commercial solar panels can produce. A system in Arizona will generate vastly different output than the same equipment in Washington, understanding these regional differences is critical for accurate ROI projections.
Solar production depends on peak sun hours, which measure the equivalent hours per day when sunlight delivers 1,000 watts per square meter. Southern states like Arizona, Nevada, and Texas typically receive 5.5 to 7 peak sun hours daily, while northern regions like Washington or Maine average 3.5 to 4.5. This translates to significant production variance: a 100kW commercial system in Phoenix might generate 175,000 kWh annually, while the identical system in Seattle produces around 120,000 kWh.
Coastal versus inland locations also matter. Coastal areas often experience more cloud cover, reducing direct sunlight, while inland desert regions enjoy clearer skies year-round. Altitude affects performance too, higher elevations receive more intense sunlight due to thinner atmosphere.
Even neighboring cities can show notable differences. Sacramento and San Francisco, just 90 miles apart, have a 15-20% production gap due to coastal fog patterns. Local microclimates, proximity to water, and regional weather patterns all influence actual output.
The good news? Modern solar technology remains viable across all U.S. regions. While sunnier locations maximize production, factors like tilt and orientation affect yield significantly, allowing northern businesses to optimize their systems for local conditions. Understanding your specific location’s solar potential ensures realistic expectations and proper system sizing from day one.
Panel Orientation and Tilt Angle
For commercial solar installations, panel orientation and tilt angle can make a 20-30% difference in annual energy production compared to suboptimal positioning.
In the Northern Hemisphere, panels should face true south to capture maximum sunlight throughout the day. True south differs from magnetic south, so professional installers use specialized tools to ensure accurate alignment. East or west-facing arrays can still be viable but typically produce 10-15% less energy annually.
The optimal tilt angle depends on your latitude. A general rule: set the tilt angle equal to your latitude for year-round production, or adjust seasonally (latitude plus 15 degrees in winter, minus 15 degrees in summer) if your business has seasonal energy needs. However, commercial flat roofs often use a 10-15 degree tilt as a practical compromise. This lower angle sacrifices some peak efficiency but simplifies installation, reduces wind loads, and allows more panels per roof area.
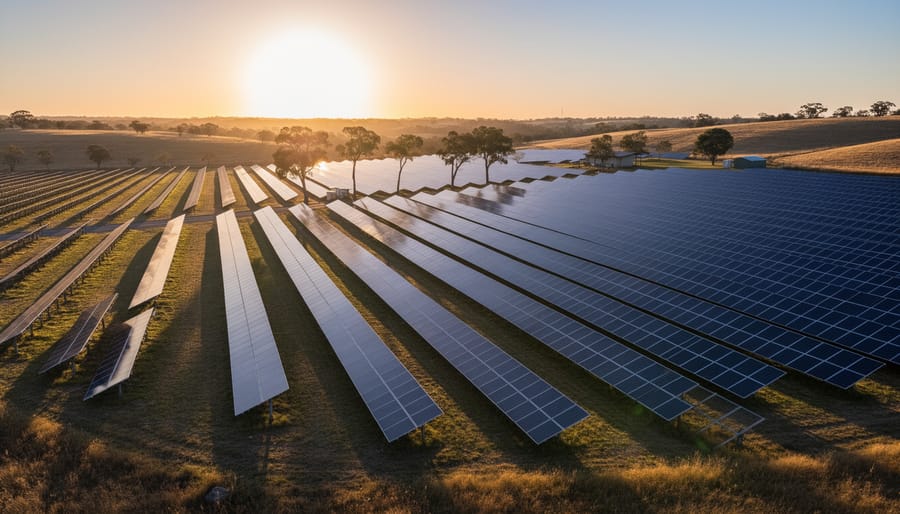
Ground-mounted commercial systems offer more flexibility. You can optimize orientation and tilt precisely, and some businesses invest in single-axis tracking systems that follow the sun’s path. These trackers increase production by 25-35% but add mechanical complexity and cost. For most commercial applications, fixed-tilt systems at the optimal angle provide the best balance of performance and reliability.
Shading and Obstructions
Even partial shade can dramatically reduce your commercial solar system’s energy production. When a shadow falls across just a few cells in a panel, it doesn’t reduce output proportionally, it can cut production by 30% or more from that entire panel due to how cells are wired together.
Common obstructions for commercial properties include HVAC units, rooftop equipment, nearby taller buildings, communication towers, and perimeter trees. A shadow moving across your array during peak production hours costs you money every minute it blocks sunlight.
Before installation, professional solar companies conduct comprehensive shade analysis using tools that map sun paths throughout the year. They identify problem areas and design around them, sometimes adjusting panel placement, sometimes trimming vegetation, or choosing microinverters that isolate shading effects to individual panels rather than compromising entire strings.
For existing buildings with unavoidable obstructions, ground-mounted systems offer an alternative that sidesteps rooftop shading issues entirely. The investment in proper site assessment and strategic system design pays for itself many times over in sustained energy production and maximized ROI.
Weather Patterns and Seasonal Variations
Commercial solar panels don’t produce the same amount of energy year-round. Your system will generate significantly more power during summer months when days are longer and the sun sits higher in the sky. A typical commercial installation in the Mid-Atlantic region might produce 30-40% more energy in June compared to December.
Cloud cover reduces output by 40-90% depending on thickness. A partly cloudy day might still yield 50-70% of clear-sky production, while heavy overcast conditions drop output to 10-25%. This matters for commercial operations because consecutive cloudy weeks during winter can substantially impact your energy offset.
Temperature also plays a surprising role. Panels actually produce more efficiently in cooler conditions. While summer brings longer days, extreme heat above 77°F reduces panel efficiency by roughly 0.5% per degree. This means a 95°F summer day produces less per hour than an equally sunny 65°F spring day, even though summer’s extended daylight still yields higher daily totals.
Smart businesses account for these variations when planning energy usage and storage needs. Many commercial clients shift energy-intensive operations to peak production periods when possible, maximizing the value of their solar investment throughout seasonal fluctuations.
Panel Efficiency and Technology Type
The technology behind your solar panels directly affects how much power you generate from the same amount of roof space. In 2026, commercial installations primarily use three panel types, each with distinct efficiency profiles and ideal applications.
Monocrystalline panels dominate the commercial market, delivering 20-23% efficiency in current models. Their black appearance and space-efficient design make them the go-to choice for businesses with limited roof area or those seeking maximum output per square foot. These panels perform better in low-light conditions and maintain higher efficiency in hot weather compared to alternatives.
Polycrystalline panels offer 17-19% efficiency at a lower upfront cost. While they require more space to generate the same power as monocrystalline options, they make economic sense for warehouses, industrial facilities, and agricultural operations with abundant roof or ground space. The blue-tinted panels have narrowed the efficiency gap in recent years.
Thin-film technology, at 12-15% efficiency, serves specialized commercial applications. Its flexibility and lighter weight suit unconventional installations like curved roofs or structures with weight restrictions. Some businesses choose thin-film for its superior performance in partial shading and consistent output across varying temperatures.
| Technology | Efficiency Range | Best For |
|---|---|---|
| Monocrystalline | 20-23% | Limited roof space, maximum output |
| Polycrystalline | 17-19% | Large facilities, cost-conscious projects |
| Thin-Film | 12-15% | Unique structures, partial shading tolerance |
For most commercial clients, monocrystalline panels deliver the strongest combination of output, longevity, and space efficiency. A 400-watt monocrystalline panel produces roughly 25% more energy than a polycrystalline panel of the same physical size, which translates to fewer panels needed and lower installation costs despite the higher per-panel price.
Calculating Your Commercial System’s Total Energy Production
Once you understand individual panel output, scaling up to your complete commercial system becomes straightforward. The basic calculation multiplies your panel wattage by the number of panels, then factors in your location’s average daily sun hours to estimate real-world production.
Start with your system size in kilowatts. If you’re installing 100 panels rated at 400 watts each, that’s 40 kilowatts (40 kW) of total capacity. Next, multiply by your area’s peak sun hours, let’s say 5 hours for a business in southern California. This gives you 200 kWh of production on an average day (40 kW × 5 hours = 200 kWh).
For monthly estimates, multiply daily production by roughly 30 days. In our example, that’s 6,000 kWh per month. Annual production runs around 73,000 kWh (200 kWh × 365 days). Keep in mind these are theoretical maximums.
Real-world production typically runs 75-85% of theoretical capacity due to system losses. These losses come from inverter efficiency (usually 96-98%), wiring resistance, soiling, and temperature effects. Apply a derating factor of 0.80 to get realistic numbers. Our 40 kW system would actually produce closer to 160 kWh daily, 4,800 kWh monthly, and 58,400 kWh annually.
A warehouse in Phoenix with 200 panels (80 kW capacity) and 6.5 peak sun hours would generate roughly 416 kWh daily before losses, or about 333 kWh after applying the 0.80 factor. That translates to nearly 122,000 kWh annually, enough to offset a substantial portion of typical industrial energy consumption.
Your actual production depends on all the factors we covered earlier. A professional site assessment accounts for your specific conditions, local weather patterns, and electrical usage profile to provide accurate projections tailored to your business operations.
Real-World Production: What Our Commercial Clients Actually See
When we installed a 250 kW commercial array for Riverside Manufacturing in early 2025, the system produced 32,890 kWh in its first full month of operation. That translated to a 68% reduction in their monthly electricity costs, exceeding the 60% offset we’d projected during the initial assessment. The facility’s operations manager tracked production closely through the first year and reported total generation of 387,400 kWh, which saved the company $46,488 in utility expenses.
A 180 kW installation we completed for Greenfield Distribution Center in Texas demonstrates how geographic advantages impact real-world output. Despite the smaller system size compared to Riverside, this facility generated 356,200 kWh annually thanks to Texas’s abundant sunshine and optimal positioning. The warehouse operates primarily during daylight hours, allowing them to use solar production when it peaks and minimize grid dependence during their highest consumption periods.
We were skeptical about the production estimates, but our actual numbers have consistently beaten projections. The solar array generates enough power to run our entire packaging operation during business hours, and we’re selling excess back to the grid most afternoons.
Medical office complexes present different production scenarios because their energy needs remain high during evening hours. A 95 kW system we installed for Summit Medical Plaza in Colorado produces approximately 142,500 kWh yearly, covering about 52% of the building’s total consumption. While the offset percentage is lower than our industrial clients, the facility benefits from stable production across seasons and predictable cost savings that have averaged $1,280 monthly since the system went online.
Our monitoring data from 40+ commercial installations reveals that systems consistently perform within 3-5% of projected annual output when properly maintained. The handful of installations that underperformed did so because of unexpected shading from new construction nearby or deferred maintenance that allowed debris accumulation. Regular cleaning and monitoring keep production at expected levels, and most clients see their systems generate slightly more energy than conservative estimates suggested during the planning phase.
Maximizing Your Commercial Solar Panel Output
Understanding your solar panel’s production potential is one thing, actually achieving it is another. Commercial solar systems require strategic management to consistently deliver peak performance and protect your energy investment.
Regular maintenance forms the foundation of optimal output. Schedule professional cleanings at least twice yearly to remove accumulated dust, pollen, and debris that can reduce efficiency by 15-25%. In high-pollution or agricultural areas, quarterly cleanings may be necessary. Inspect panels for physical damage, loose connections, and degraded sealing after severe weather events.
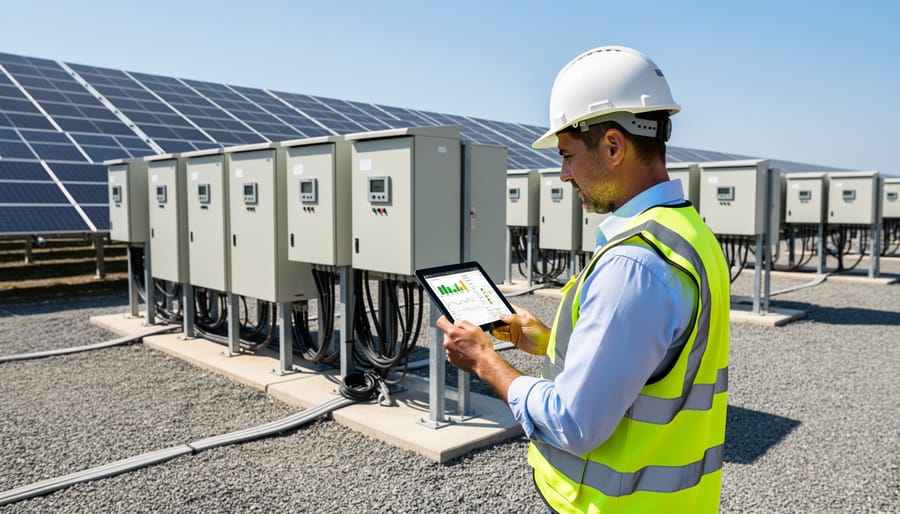
Real-time monitoring systems provide immediate visibility into production patterns and performance issues. Modern commercial monitoring platforms alert you to underperforming panels or inverter problems before they significantly impact your energy generation. These systems typically pay for themselves through early problem detection and resolution.
Inverter efficiency directly affects your system’s overall output. Standard string inverters should be replaced or serviced every 10-12 years, while microinverters and power optimizers often last longer but cost more initially. Upgrading from older inverter technology can recover 3-8% lost efficiency in aging systems.
Vegetation management matters more than most business owners realize. Trees that seemed harmless at installation can grow to cast shadows that devastate panel performance. Trim branches proactively and remove any new growth that threatens your array’s sun exposure.
Consider strategic system expansions as your business grows. Adding panels to existing arrays is often more cost-effective than initial installation. If your roof can’t accommodate more panels, ground-mounted additions or carport structures can boost total production while serving dual purposes.
Temperature management helps too. Panels lose efficiency as they heat up, so adequate ventilation and airflow beneath your array maintain cooler operating temperatures and better performance during peak summer production months.
How Production Translates to Cost Savings and ROI
Understanding production numbers is valuable, but what really matters to your bottom line is how those kilowatt-hours translate into dollars saved and long-term return on investment.
A typical 100kW commercial solar system producing 450-550 kWh per day can offset 70-90% of a business’s energy consumption, depending on usage patterns. At commercial electricity rates averaging $0.11-0.15 per kWh in 2026, this daily production saves businesses $50-80 per day, or roughly $1,500-2,400 monthly. Over a year, that’s $18,000-29,000 in avoided energy costs from a single system.
The calculation is straightforward: multiply your system’s annual production by your current commercial electricity rate. If your panels generate 150,000 kWh annually and you’re paying $0.13 per kWh, you’re looking at $19,500 in yearly savings. These savings compound over the system’s 25-30 year lifespan, often exceeding $500,000 in total avoided costs.
Payback periods for commercial installations typically range from 5-8 years, meaning after that point, every kilowatt-hour your panels produce is pure profit. A business investing $120,000 in solar with $20,000 annual savings reaches payback in six years, then enjoys two decades of essentially free electricity.
ROI calculations extend beyond utility bill reduction. Many businesses see increased property values, enhanced corporate sustainability profiles that attract environmentally-conscious clients, and protection against future utility rate increases that historically average 2-3% annually. When electricity costs rise, your solar-generated power becomes even more valuable.
Production consistency matters here too. Systems in high-sun regions with minimal shading deliver more predictable savings, making financial projections more reliable and reducing investment risk for commercial operations planning their energy future.
Understanding exactly how much energy your commercial solar panels produce isn’t just about satisfying curiosity, it’s about making smart financial decisions that impact your bottom line for decades to come. Armed with real production data, you can accurately forecast utility savings, calculate ROI timelines, and plan for energy independence with confidence.
At Sun Power Solutions, we’ve helped hundreds of businesses across the region transition to clean energy, and we’ve seen firsthand how proper system sizing and realistic production expectations lead to satisfied clients. Our installations consistently meet or exceed projected output because we account for every factor that affects performance, from your roof’s orientation to regional weather patterns.
Beyond individual business benefits, every kilowatt-hour your panels produce contributes to a cleaner environment and stronger local economy. Our commercial clients have collectively offset thousands of tons of carbon emissions while keeping energy dollars in our community rather than sending them to utility companies.
Ready to see what solar production numbers look like for your specific facility? We offer complimentary site assessments that provide detailed production estimates tailored to your location, energy needs, and business goals. Contact Sun Power Solutions today to discover your solar potential and start your journey toward energy independence.
